Organizing Streamlit Dashboards with Functions
When I first started building my dashboard with Streamlit, it was working out pretty good, however after a while my ‘dashboard.py’ script had turned into a nightmare to edit. It was over 1000 lines of code and trying to find the right parts of the script to edit was becoming a nightmare. I had been coding, but not organizing or structuring it at all.
The Function-Based Solution
I decided I needed to take a step back and think about a better way to do it. I realized one step I could take was have a script where all my functions were defined, then import them into my dashboard, something like this:
from forecast_script import (
    train_test_split,
    create_features,
    run_naive_forecast,
    run_sarima,
    run_ets,
    run_xgboost,
    evaluate_forecasts
)
This was awesome as all I had to do in actual dashboard was call the function and it made it easier to manage because I knew streamlit code was in the dashboard script and my functions were in the forecast script. But eventually this got too complicated too so I took it a step further and made each page in my dashboard a file and function. now I had two more functions and two more python files.
from forecast_script import (
    train_test_split,
    create_features,
    run_naive_forecast,
    run_sarima,
    run_ets,
    run_xgboost,
    evaluate_forecasts
)

def model_comparison_page():
    #....
from retails_script import (
load_and_preprocess,
detect_seasonality_periods
)
from resampling_functions import(
add_resampling_section
)
def data_overview_page():
#...that meant my dashboard.py file went from over 1000 lines of code (and would’ve been much more in the end) and a nightmare to edit to a organized file structure with different files for different things and only about 20 lines of code.
import streamlit as st
from data_overview_page import data_overview_page
from model_comparison import model_comparison_page
# Set up the page config first
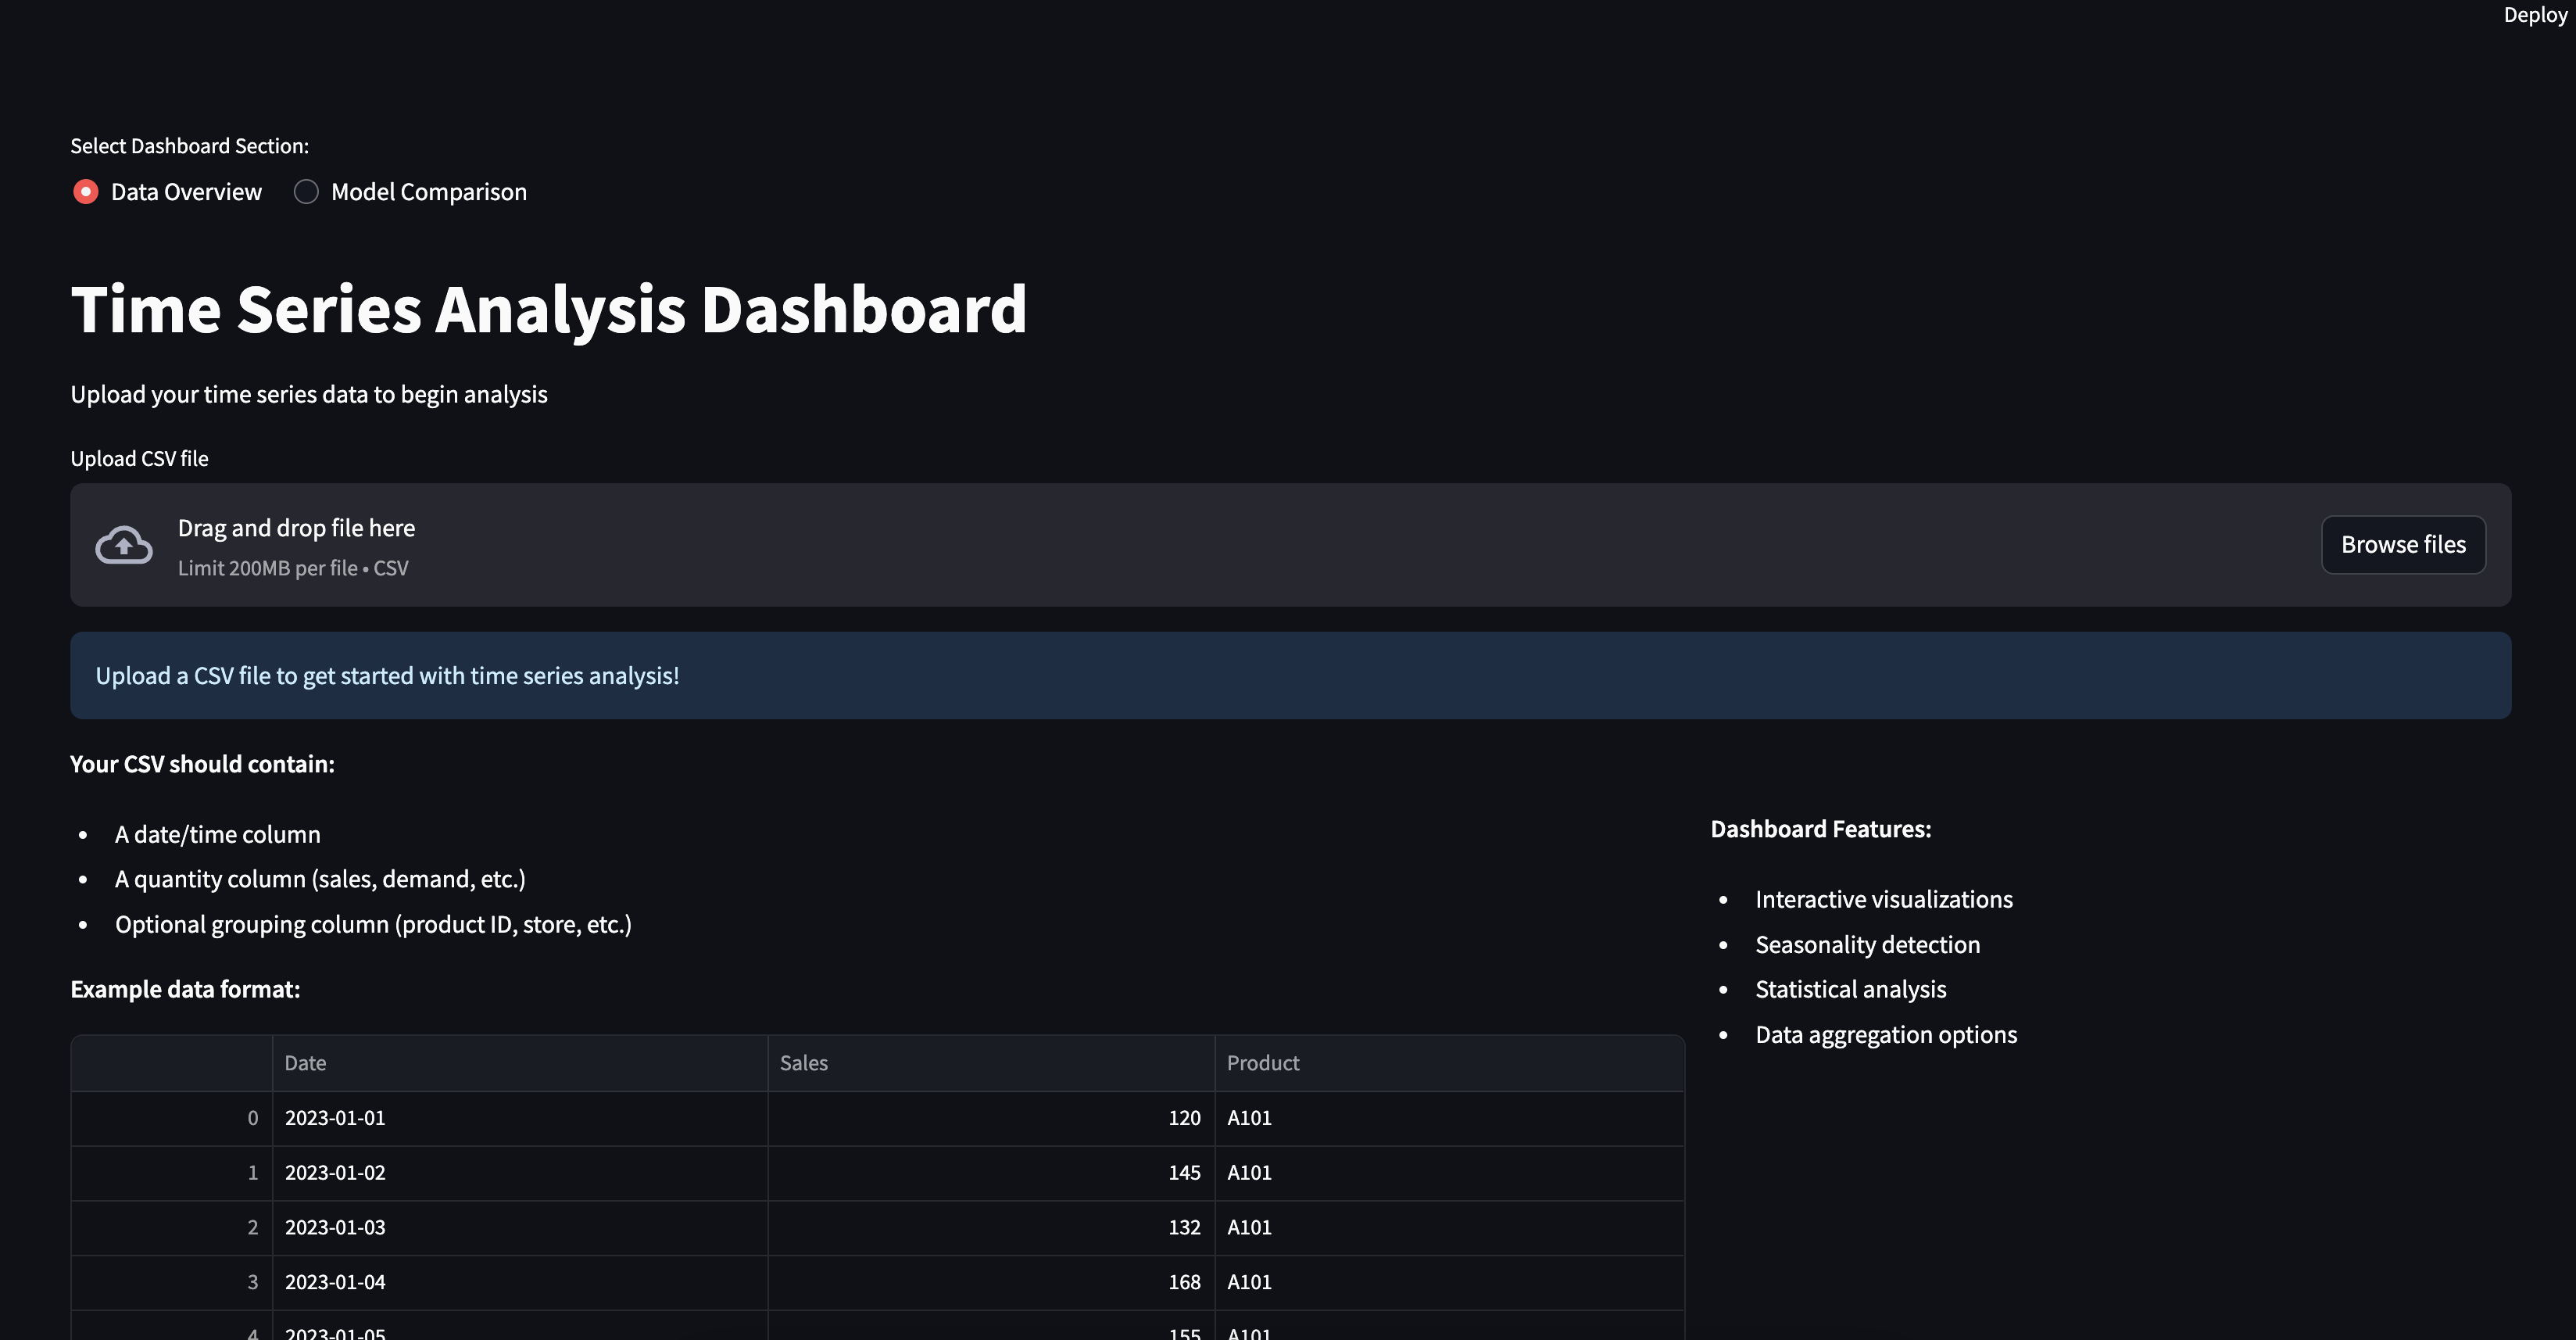
st.set_page_config(
page_title="Time Series Analysis Dashboard",
layout="wide"
)
selected_page = st.radio(
"Select Dashboard Section:",
["Data Overview", "Model Comparison"],
horizontal=True
)
if selected_page == "Data Overview":
data_overview_page()
elif selected_page == "Model Comparison":
model_comparison_page()Conclusion
I know it may seem like I didn’t really do anything and I just ‘shoved it under the bed’ so things look cleaner. But working on everything became so much easier. Refactoring my Streamlit dashboard using a function-based approach dramatically improved its maintainability. What was once a sprawling script is now a well-organized collection of focused functions, each with a clear purpose. I realized I had basically just applied abstraction, a concept I learned about in my programming with classes course, to Python.
This modular approach is actually a fundamental programming principle that extends beyond just Streamlit applications. When functions are organized logically and serve a single purpose, it makes the entire development process smoother and more enjoyable. I know that all may seem like common sense to software engineers, but as a data sciencetist its something I realize I need to think about much more because I can’t just make a new jupyter notebook called ‘project_V4.ipynb’ everytime my codes gets messy.